Ethereum Technical Analysis, Trend analysis, Volatility, Momentum and volume analysis with overview and summary of the key points.
Ethereum Technical Analysis
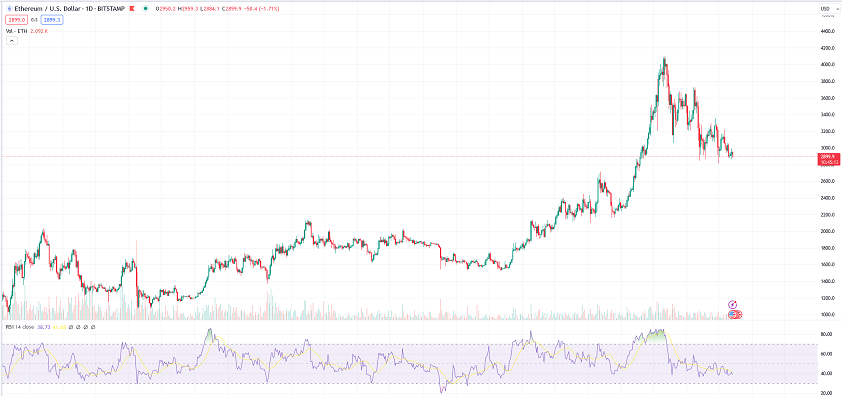
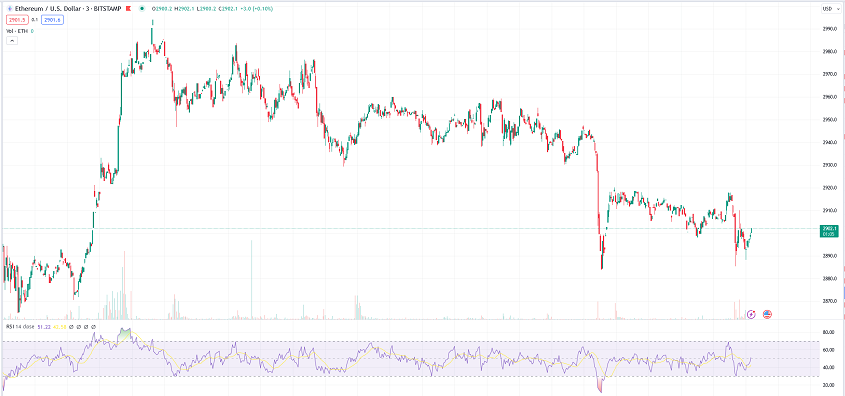
At the present moment, Ethereum’s value against the US dollar stands at 2,888.29, marking a decline of 62.01 or -2.1% from its previous closing rate of 2,950.3. Trading activity has surged to 11.34 billion, a notable 63.4% surge compared to the average. The asset appears to be following a downward trajectory, as suggested by the moving averages – the simple moving average 200 resting at 2,705 and the simple moving average 50 at $3,227.47.
Ethereum Market Trend:
The market trend indicators are pointing towards a bearish outlook, with the simple moving averages showing a clear downward movement. The vortex indicator difference is recorded at -28.2858 cents, signaling a negative trend. Furthermore, the Parabolic SAR depicts a downward shift, with the upper band at 2,873.42 and the lower band at 3,334.59.
Ethereum Volatility Analysis:
Volatility indicators hint at a moderate level of price fluctuation. The Bollinger Bands band width sits at 14.31, while the Keltner Channel band width is at 7.15. Additionally, the Donchian Channel width is at $17.94, indicating some price oscillation.
Ethereum Momentum Evaluation:
Momentum indicators align with a bearish momentum, with the relative strength index stationed at $39.87 and the stochastic RSI at 17.3076 cents. The Williams %R is currently at -73.6, signifying an oversold condition.
Ethereum Volume Assessment:
Volume analysis reflects mixed signals, with the accumulation distribution index at 360.90 billion and the on-balance volume at 193.33 billion. The Chaikin Money Flow registers at -7.2611 cents, underlining some selling pressure in the market.
overview
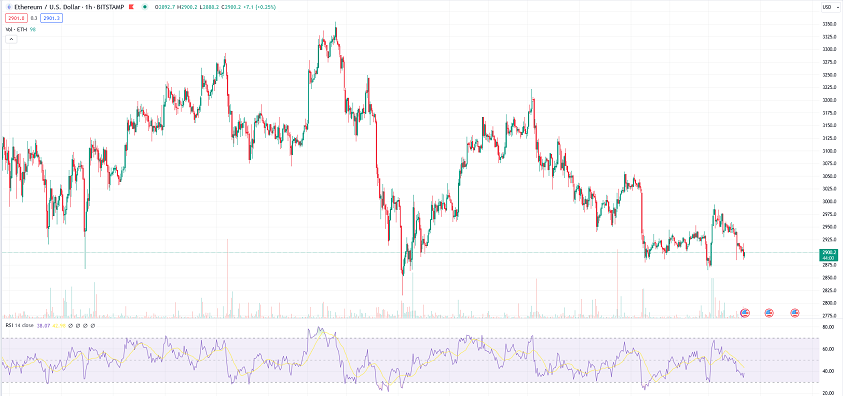
Today, Ethereum USD (ETHUSD) is presently valued at 2,895, reflecting a drop of 55.3 or -1.87% from the previous closing price of $2,950.3. The trading volume for ETHUSD stands at 11.34 billion, marking a 63.4% increase compared to the standard volume. This price decline can be attributed to market dynamics and investor sentiment, leading to a distinctive trading pattern for the day.
Performance Streak
ETHUSD has encountered a streak of three continuous days of price movements, with a total absolute shift of -14.42 and a percentage variation of -0.5%. This streak initiated at a price of 2,909.42, revealing a stable pattern in price fluctuations over recent trading sessions.
In general, Ethereum USD is currently amidst a descending price trend, evidenced by the consecutive price drops. The surge in trading volume indicates heightened market activity and potential fluctuations in the asset’s valuation. It is advisable for investors to diligently track developments concerning ETHUSD to formulate well-informed investment strategies.
summary of the key points.
- Ethereum Technical Analysis:
- Current Value: 2,888.29 USD
- Change: -62.01 USD, -2.1% decrease from the previous closing rate.
- Trading Activity: 11.34 billion, a significant 63.4% surge compared to the average.
- Moving Averages: Simple moving average 200 at 2,705 and simple moving average 50 at 3,227.47, indicating a downward trajectory.
- Ethereum Market Trend:
- Trend Indicators: Bearish outlook, with moving averages showing a clear downward movement.
- Vortex Indicator: Difference at -28.2858 cents, signaling a negative trend.
- Parabolic SAR: Depicts a downward shift, upper band at 2,873.42 and lower band at 3,334.59.
- Ethereum Volatility Analysis:
- Bollinger Bands Band Width: 14.31
- Keltner Channel Band Width: 7.15
- Donchian Channel Width: $17.94, indicating moderate price oscillation.
- Ethereum Momentum Evaluation:
- Momentum Indicators: Bearish momentum, RSI at $39.87, Stochastic RSI at 17.3076 cents, Williams %R at -73.6 (oversold condition).
- Ethereum Volume Assessment:
- Accumulation Distribution Index: 360.90 billion
- On-Balance Volume: 193.33 billion
- Chaikin Money Flow: -7.2611 cents, suggesting selling pressure in the market.
- Overview:
- Current Value: 2,895 USD, a 1.87% decrease from the previous closing price.
- Trading Volume: 11.34 billion, a 63.4% increase compared to standard volume.
- Price Movement: Reflects market dynamics and investor sentiment, leading to distinct trading patterns for the day.
- Performance Streak:
- Three consecutive days of price movements, with a total absolute shift of -14.42 and a percentage variation of -0.5%.ETHUSD is amidst a descending price trend, with heightened market activity and potential fluctuations in valuation.
Investors are advised to stay informed about developments regarding Ethereum USD to make well-informed investment decisions.
Crypto Technical Analysis Explained: Tools and Techniques for Cryptocurrency Investors
what is Technical Analysis? A Beginner’s Guide to Market Insights