By using this site, you agree to the Privacy Policy and Terms of Use.
Accept
cryptocrazecoinscryptocrazecoinscryptocrazecoins
  • Home
  • Daily News
  • Market Analysis
  • Predictions
  • Beginner’s Guide
Search
© 2022 Foxiz News Network. Ruby Design Company. All Rights Reserved.
Reading: Dogecoin Technical Analysis 22 may 2024: Bullish Momentum Continues in 2024
Share
Sign In
Notification Show More
Font ResizerAa
cryptocrazecoinscryptocrazecoins
Font ResizerAa
Search
  • Home
  • Daily News
  • Market Analysis
  • Predictions
  • Beginner’s Guide
Have an existing account? Sign In
Follow US
© 2024 Cryptocrazecoins. WebSeo Agency Design Company. All Rights Reserved.
cryptocrazecoins > Blog > Blog > Dogecoin Technical Analysis 22 may 2024: Bullish Momentum Continues in 2024
BlogMarket Analysis

Dogecoin Technical Analysis 22 may 2024: Bullish Momentum Continues in 2024

cryptocraze
Last updated: June 8, 2024 1:23 pm
cryptocraze
Share
4 Min Read
Dogecoin price Analysis
SHARE

Introduction to Dogecoin

Dogecoin (DOGE), originally created as a meme cryptocurrency, has evolved into a widely recognized digital asset. Launched in December 2013 by Billy Markus and Jackson Palmer, Dogecoin was inspired by the popular “Doge” meme featuring a Shiba Inu dog. Despite its origins as a joke, Dogecoin has garnered a significant following and has been used for various charitable causes and online tipping. Its popularity surged notably in 2021, largely fueled by endorsements from high-profile individuals and a strong online community.

Contents
Introduction to DogecoinCurrent Market StatusTrend AnalysisVolatility AnalysisMomentum AnalysisVolume AnalysisConclusion

Current Market Status

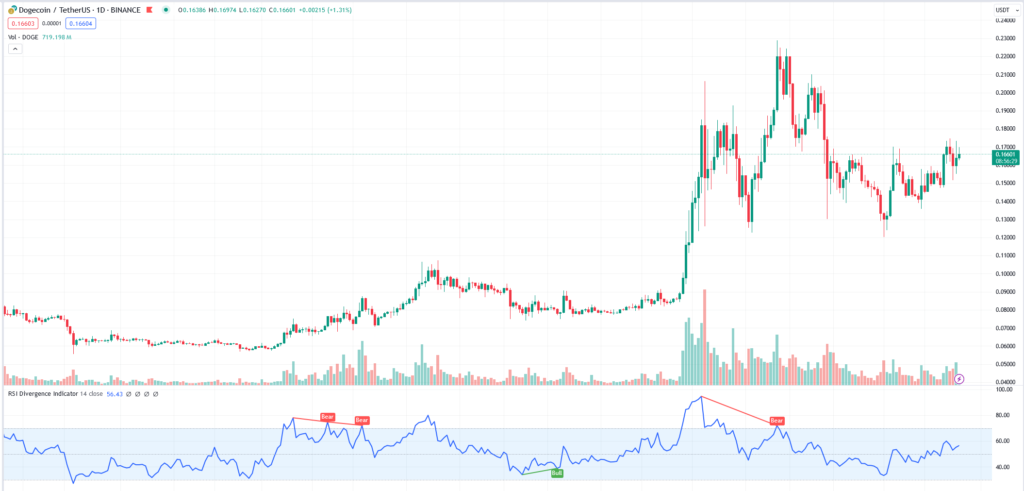
As of the latest data, Dogecoin is trading at $0.16604, reflecting a 1.31% increase from the previous close of $0.164. The trading volume for DOGEUSD stands at 1.72 billion, which is 69% higher than the average volume, indicating increased investor interest and market activity.

Trend Analysis

Analyzing Dogecoin’s trend indicators reveals a strong positive momentum. The simple moving averages (SMA) provide insight into the general direction of the price movement:

  • 5-day SMA: $0.165498
  • 200-day SMA: $0.118307

The significant difference between the short-term and long-term SMAs indicates a bullish trend. Additionally, the Moving Average Convergence Divergence (MACD) shows a positive value of $0.002311, further supporting the bullish sentiment.

dogecoin daily price chart 05.25.2024

Volatility Analysis

Volatility indicators such as Bollinger Bands and the Keltner Channel suggest moderate price variability for Dogecoin. The Bollinger Bands have a bandwidth of 22.09, indicating the range within which the price is expected to fluctuate. The Keltner Channel shows a band width of 16.1, reflecting similar volatility levels. These indicators suggest that while Dogecoin experiences price swings, they are within a predictable range, allowing traders to strategize accordingly.

Momentum Analysis

Momentum indicators, including the Relative Strength Index (RSI) and Stochastic RSI, reveal strong buying sentiment:

  • RSI: 56.12, indicating a bullish market.
  • Stochastic RSI K: 72.7706
  • Stochastic RSI D: 82.5562

The high Stochastic RSI values indicate overbought conditions, suggesting that while the buying momentum is strong, traders should be cautious of potential corrections.

Volume Analysis

Volume analysis provides insight into the strength and sustainability of the current trend. Key volume indicators include:

  • Accumulation Distribution Index: 21.98 billion, indicating significant capital inflow.
  • On Balance Volume (OBV): 33.76 billion, confirming positive market sentiment.

The high volume levels support the bullish trend, suggesting that the price increase is backed by strong investor interest and not just speculative trading.

Conclusion

In conclusion, Dogecoin is currently experiencing a bullish trend, supported by positive momentum, moderate volatility, and high trading volume. The technical indicators suggest that Dogecoin may continue its upward trajectory in the near term. However, investors should remain vigilant and consider potential market corrections due to the overbought conditions indicated by the Stochastic RSI.

Disclaimer: This analysis is based on current market data and technical indicators. It is not financial advice. Cryptocurrency investments carry inherent risks, and it is essential to conduct thorough research and consider your risk tolerance before making any investment decisions.

Unleashing Dogecoin: Analyst Forecasts a Monumental Surge with $1 Bullseye

https://coinmarketcap.com/currencies/dogecoin

You Might Also Like

Bitcoin USD Shows Positive Momentum Amidst Volatile Market Conditions

Dogecoin, XRP and Solana Technical Analysis for 08/18/2024

Ripple (XRP) Shows Stability Amidst Market Volatility

Bitcoin Technical Analysis and Market Trends: June 2024

Analysis of Floki, Notcoin, and Bome: Market Trends and Future Predictions

TAGGED:doge newsdogecoindogecoin news
Share This Article
Facebook Twitter Copy Link Print
Share
Previous Article cryptopia From Hack to Alleged Fraud 100 cryptopia: From Hack to Alleged Fraud
Next Article BOOK OF MEME (BOME): A Beginner's Guide and Future Prospects BOOK OF MEME (BOME): A Beginner’s Guide and Future Prospects
1 Comment 1 Comment
  • Pingback: Analyzing the Daily Chart of Dogecoin (DOGE/USDT): Long or Short Position? 06/05/2024 - cryptocrazecoins

Leave a Reply Cancel reply

Your email address will not be published. Required fields are marked *

Follow US

Find US on Socials
TwitterFollow
InstagramFollow
YoutubeSubscribe
TelegramFollow
Name Price24H (%)
bitcoin
Bitcoin(BTC)
$105,483.00
-0.61%
ethereum
Ethereum(ETH)
$2,597.71
-0.67%
tether
Tether(USDT)
$1.00
0.02%
ripple
XRP(XRP)
$2.25
1.81%
binancecoin
BNB(BNB)
$661.43
-1.18%
solana
Solana(SOL)
$155.47
-1.24%
usd-coin
USDC(USDC)
$1.00
0.00%
dogecoin
Dogecoin(DOGE)
$0.193522
-1.72%
tron
TRON(TRX)
$0.270767
0.74%
cardano
Cardano(ADA)
$0.69
-1.01%
Popular News
what is Technical Analysis
what is Technical Analysis? A Beginner’s Guide to Market Insights
dogecoin Real-Time full Analysis for 05/14/2024
Dogecoin Real-Time full Analysis for 05/14/2024
The Best memecoin Investment for $2000: A Comprehensive Analysis of PEPE, SHIB, BONK, FLOKI, and DOGE
The Best Memecoin Investment for $2000: A Comprehensive Analysis of PEPE, SHIB, BONK, FLOKI, and DOGE
pepe coin news pepecoin
Unleashing the Hype: Binance Adds Pepe Coin to Their List
dogecoin news
Unleashing Dogecoin: Analyst Forecasts a Monumental Surge with $1 Bullseye
FLOKI Inu's Meteoric Rise Could $0.01, $0.1 and $1
FLOKI Inu’s Meteoric Rise: Could $0.01, $0.1, or Even $1 Be Within Reach?
floki news
Floki Inu Unveiled: Decoding the Fusion of Movement and Meme-Coin
Crypto Technical Analysis
Crypto Technical Analysis Explained: Tools and Techniques for Cryptocurrency Investors

You Might also Like

dogecoin daily price chart 06.05.2024
PredictionsBlogEditor's PicksMarket Analysis

Analyzing the Daily Chart of Dogecoin (DOGE/USDT): Long or Short Position? 06/05/2024

cryptocraze cryptocraze June 5, 2024
Pepecoin Skyrockets: The Meme Coin Mania Continues
Daily NewsMarket Analysis

Pepecoin Skyrockets: The Meme Coin Mania Continues

cryptocraze cryptocraze June 4, 2024
Notcoin Price Surges: A Comprehensive Analysis of Its Meteoric Rise
Market AnalysisDaily News

Notcoin Price Surges: A Comprehensive Analysis of Its Meteoric Rise to 0.022

cryptocraze cryptocraze June 3, 2024
Follow US
© 2024 Cryptocrazecoins. WebSeo Agency Design Company. All Rights Reserved.
Welcome Back!

Sign in to your account

Lost your password?