Stay ahead in crypto trading with Bitcoin, Ethereum, BNB, Solana, Ripple, Dogecoin, & Cardano technical analysis. Trade smarter today!
Bitcoin (BTC)
Technical Overview:
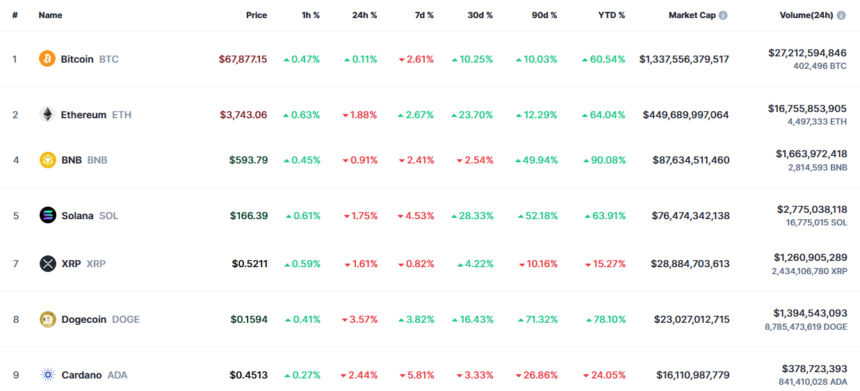
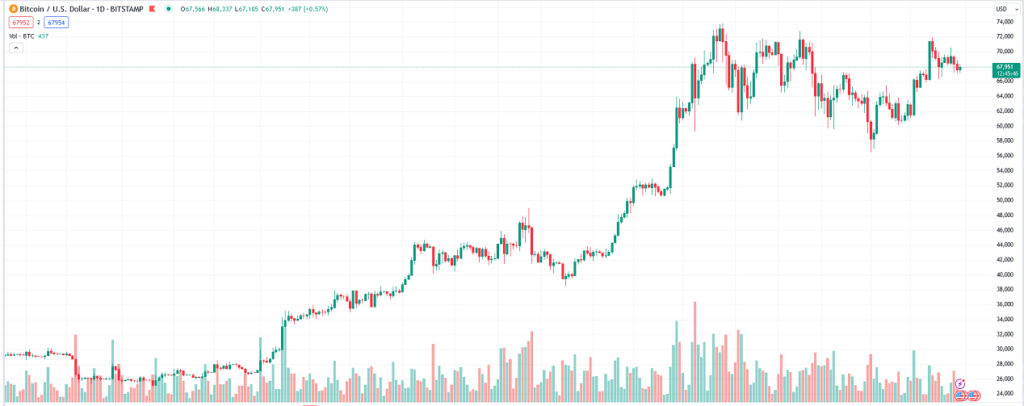
As of May 30, 2024, Bitcoin (BTC) is priced at $67,700, showing a slight increase of 0.2% from the previous close. The trading volume is at $27.17 billion, which is significantly higher than the average, indicating strong investor interest.
Trend Indicators:
- The 5-day moving average is at $68,534, and the 10-day moving average is at $69,000, both showing a bullish trend.
- The Moving Average Convergence Divergence (MACD) stands at $1,265.73, indicating positive momentum.
- The Relative Strength Index (RSI) is at 52, suggesting neutral momentum, while the Stochastic RSI indicates a potential reversal.
Volatility Indicators:
- Bitcoin’s Bollinger Bands show a bandwidth of 19.24, with the middle band at $66,455 and the high band at $72,849.
- The Keltner Channel shows a narrower bandwidth of 7.77 with the middle band at $68,935, indicating moderate volatility.
Volume Analysis:
- The accumulation distribution index is at 716.29 billion, showcasing strong buying pressure.
- The on-balance volume is at 596.40 billion, supporting the bullish sentiment in the market.
Market Sentiment and Recent News:
- Positive News:
- Bitcoin Halving Event: The recent halving event in April 2024 has reduced mining rewards from 6.25 BTC to 3.125 BTC per block. Historically, halving events have led to significant price increases due to the reduced supply of new bitcoins (Kitco) (CoinDesk).
- ETF Approvals: The approval of Bitcoin spot price ETFs by the SEC in January 2024 has boosted market confidence. This move is expected to attract more institutional investors, potentially driving prices higher (CoinDesk).
- Market Sentiment: Despite recent price drops, market sentiment remains positive. Analysts are optimistic about Bitcoin’s performance, with some predicting a potential rise to $100,000 in 2024 (Kitco).
- Negative News:
- Regulatory Concerns: Ongoing regulatory scrutiny remains a significant concern. The European Central Bank (ECB) has criticized Bitcoin, citing its use in illicit transactions and questioning its value as an investment. These concerns could impact investor sentiment and market stability (Kitco).
- Environmental Impact: Bitcoin mining’s high energy consumption continues to draw criticism. The environmental impact of mining operations could lead to stricter regulations, potentially affecting the profitability of mining and the overall market (CoinDesk).
- Market Volatility: Despite the positive sentiment, Bitcoin remains highly volatile. Recent price fluctuations highlight the risks associated with investing in cryptocurrencies. Investors should be prepared for potential market corrections (CoinDesk).
Conclusion:
Bitcoin (BTC) demonstrates significant strength and resilience, with several indicators pointing towards a positive trend. However, investors should remain cautious of regulatory challenges and environmental concerns that could impact the market. Continuous monitoring of market developments and informed decision-making are crucial for navigating Bitcoin investments.
For more information and updates on Bitcoin’s latest developments and market trends, visit Kitco News, CoinDesk, and Cointelegraph.
Ethereum
Technical Analysis
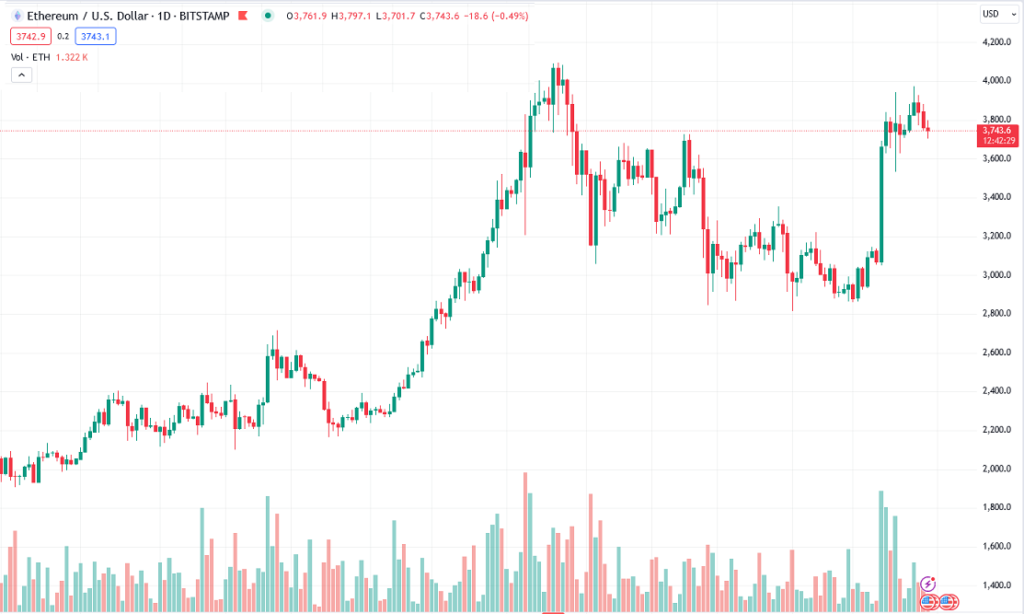
Ethereum USD (ETHUSD) is currently priced at 3,729.44, showing a decrease of 33.52 (-0.891%) from the previous close at $3,763. The trading volume stands at 13.53 billion, representing 75.36% relative to the average volume.
Trend
Looking at the trend indicators, the asset is hovering around various moving averages, with the 200-day SMA at 2,833.8 and the 50-day SMA at 3,232.64. The MACD signal is at 147.76, indicating a potential shift in momentum. The Ichimoku Conversion Line is at 3,748.52, above the Base Line at $3,417.28, suggesting a bullish trend.
Volatility
Volatility indicators reveal that the Bollinger Bands are relatively tight, with the middle band at 3,379.7. The Average True Range is 181.09, indicating moderate price volatility. The Donchian Channel shows a width of 33.05, with the lower band at 2,858.76 and the upper band at $3,975.8.
Momentum
Momentum indicators like the Relative Strength Index (RSI) at 63.81 and Stochastic RSI at 69.835 cents suggest a neutral stance. The Williams %R is at -21.51, indicating an oversold condition, while the Awesome Oscillator is at 571.6, showing strong bullish momentum.
Volume Analysis
In terms of volume analysis, the Accumulation Distribution Index is at 395.94 billion, reflecting strong buying pressure. The On-Balance Volume stands at 276.59 billion, supporting the current uptrend.
In conclusion, Ethereum USD is experiencing a period of consolidation within a volatile market. Traders should closely monitor key support and resistance levels to anticipate the next potential price movement.
Live Analysis
In the current trading session, Ethereum USD (ETHUSD) is priced at 3,731, showing a slight decrease of 32 (-0.85%) from the previous close at $3,763. The trading volume for ETHUSD is reported at 13.53 billion, representing a trading volume relative to the average of 75.36%.
Despite the minor decline in price, Ethereum USD continues to attract significant trading activity. The asset’s performance is influenced by various factors, including market sentiment, technological developments, and regulatory news related to cryptocurrencies.
Traders and investors are closely monitoring Ethereum USD for any significant price movements and trading patterns. It is essential to stay informed about the latest news and events impacting the asset to make well-informed decisions in the volatile cryptocurrency market.
As the trading session progresses, market participants will continue to analyze Ethereum USD’s performance to identify potential opportunities and risks. The price fluctuations and trading volume of ETHUSD reflect the dynamic nature of the cryptocurrency market, where rapid changes can occur within a short period.
In conclusion, Ethereum USD’s current performance highlights the importance of staying informed and vigilant in the cryptocurrency market. Traders and investors need to monitor the asset’s price movements, trading volume, and market trends to navigate the market effectively and make informed trading decisions.
Stay tuned for further updates on Ethereum USD as the trading session unfolds.
BNB
Technical Analysis
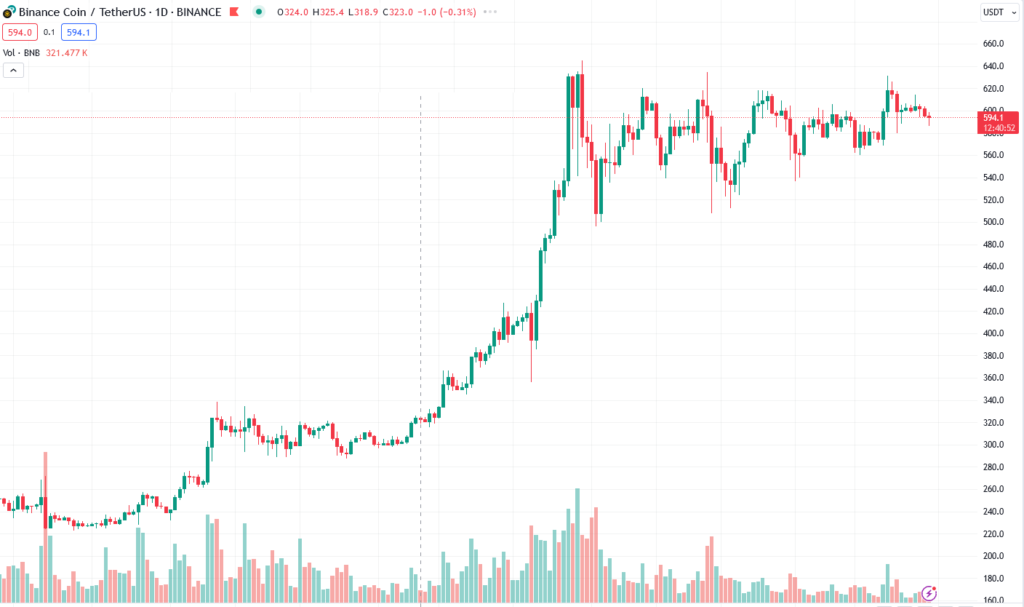
Today, BNB USD is priced at 591.67, showing a slight decrease of 3.3 from the previous close. The trading volume is at 807 million, which is 38.59% higher than the average. Despite the decrease in price, the trading volume indicates strong interest from investors.
Trend
Analyzing the trend indicators, we see a mixed picture. The simple moving averages range from 413.89 to 600.44, with the 200-day moving average significantly lower than the current price. The MACD signal is at 4.38, showing a positive trend, while the Ichimoku conversion line is at 597.55, indicating potential resistance levels.
Volatility
Volatility indicators suggest a moderate level of price variability. The Bollinger Bands show a band width of 8.28, with the middle band at 591.52. The Keltner Channel’s band width is $5.51, indicating narrower price movements compared to the Bollinger Bands.
Momentum
Momentum indicators reflect a neutral sentiment. The Relative Strength Index (RSI) is at $51.62, close to the equilibrium point of 50. The Stochastic RSI and Ultimate Oscillator also show no extreme overbought or oversold conditions.
Volume Analysis
Volume indicators point to mixed market sentiment. The Accumulation Distribution Index is at $40.37 billion, reflecting a strong inflow of capital. However, the Ease of Movement indicator is negative, suggesting some difficulty in price movement.
In conclusion, the technical analysis of BNBUSD presents a mixed outlook with indications of both bullish and bearish signals. Traders should exercise caution and closely monitor key levels to make informed decisions in the current market environment.
Live Analysis
In the current trading session, BNBUSD, which represents the price of BNB in USD, is currently priced at 591.67. The asset has experienced a slight decrease of -3.3, equivalent to -0.554% from the previous close price of $594.97. The trading volume for BNBUSD is reported at 807 million, which is 38.59% relative to the average volume.
The slight decline in price could be attributed to various factors, such as market sentiment, economic indicators, or company-specific news. Investors should keep an eye on any developments that may impact the performance of BNBUSD in the short term.
As the trading session progresses, it will be essential to monitor any significant price movements or trading patterns that may provide insights into the future direction of BNBUSD. Understanding these trends can help investors make informed decisions about buying or selling the asset.
In conclusion, while BNBUSD has shown a slight decline in the current trading session, it is crucial for investors to conduct thorough research and analysis before making any investment decisions. Stay tuned for further updates on the performance of BNBUSD as the trading session continues.
Stay informed and make wise investment choices in the dynamic world of financial markets!
Solana
Technical Analysis
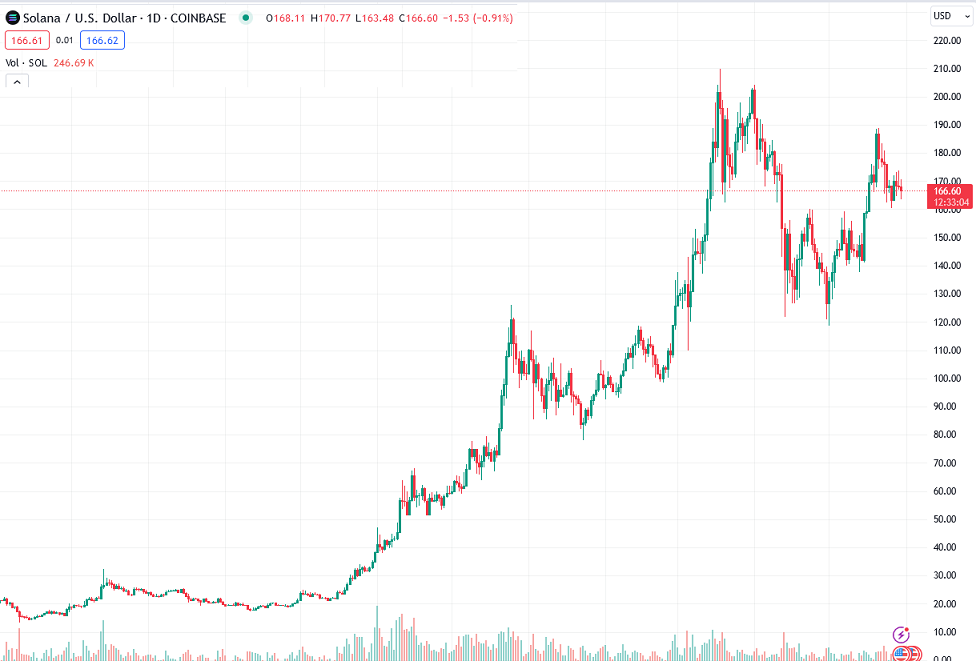
Solana USD (SOLUSD) is currently priced at 165.39, with a decrease of 2.69 (-1.6%) from the previous close at $168.08. The trading volume is significantly higher than average, standing at 2.88 billion. The asset’s price change indicates some selling pressure in the market.
Trend Indicators
Key trend indicators show that SOLUSD is currently above its simple moving averages, with the 10-day SMA at 172.43. The Moving Average Convergence Divergence (MACD) is at 5.44, indicating a potential shift in momentum. Additionally, the Ichimoku Conversion Line is at $174.63, suggesting a bullish trend.
Volatility Assessment
Volatility indicators reveal that SOLUSD is within the Bollinger Bands, with the middle band at 163.91. The Bollinger Bands’ width is 30.78, showcasing moderate price variability. The Keltner Channel also indicates a narrower band width at $12.96, which could signal a period of consolidation.
Momentum Analysis
Momentum indicators like the Relative Strength Index (RSI) at $54.72 and the Stochastic RSI at 17.9311 cents, show a neutral stance. The Williams %R indicator is at -62.81, indicating an oversold condition, potentially leading to a bullish reversal.
Volume Insights
Volume analysis highlights the Accumulation Distribution Index at 69.83 billion, reflecting positive money flow into SOLUSD. The Volume Weighted Average Price is 171.78, suggesting a strong support level based on trading volume.
In conclusion, Solana USD demonstrates resilience amidst market volatility, with indicators pointing towards a potential bullish reversal. Traders should monitor the price closely for any confirmation of a trend change.
Live Analysis
Today, Solana USD (SOLUSD) is currently priced at 165.39, showing a decrease of 2.69 from the previous close of $168.08. This translates to a 1.6% decline in price. The trading volume for SOLUSD is notably higher today, standing at 2.88 billion, which is 66.76% above the average.
The slight decrease in price could be attributed to market fluctuations or external factors impacting the cryptocurrency market. Investors should keep an eye on any significant news or events that may affect the performance of Solana USD in the near future.
Overall, SOLUSD continues to be a popular choice among traders, with its high trading volume indicating active participation in the market. It’s essential for investors to stay informed and monitor the asset’s performance closely to make well-informed decisions.
Stay tuned for more updates on Solana USD as the trading session progresses.
Ripple (XRP)
Technical Analysis
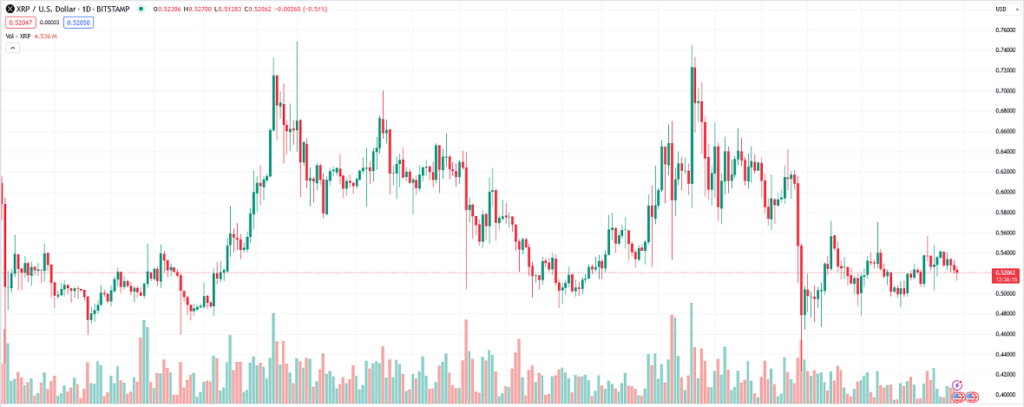
Ripple (XRP USD) is currently trading at 0.517, showing a price decrease of 0.006 or -1.1% from the previous close at $0.523. The trading volume is 991.69 million, which is 55.38% higher than the average. The asset is experiencing a downward trend with various moving averages indicating a potential bearish signal.
Trend
The simple moving averages (SMA) are trending downwards, with the SMA 200 at 57.6327 cents and SMA 50 at 52.3609 cents. The Moving Average Convergence Divergence (MACD) shows a negative signal of -0.0156 cents, indicating a bearish trend. The Ichimoku Cloud also suggests a bearish sentiment with the Conversion Line below the Base Line at 52.986 cents.
Volatility
Bollinger Bands are narrowing with a Band Width of 10.09, indicating a decrease in volatility. The Keltner Channel also shows a tightening range with a Band Width of 8.1. The Average True Range is at 1.9777 cents, suggesting relatively low volatility in the near term.
Momentum
The Relative Strength Index (RSI) is at $48.34, close to the neutral zone, indicating a lack of strong buying or selling pressure. The Stochastic RSI %K and %D are both below 50, signaling a potential oversold condition. The Williams %R is at -62.4, approaching oversold levels.
Volume Analysis
The Accumulation Distribution Index is at 60.86 billion, suggesting a lack of strong buying interest. The On-Balance Volume is at 5.12 billion, showing a neutral volume trend. The Money Flow Indicator is at $52.35, indicating a balance between buying and selling pressure.
In conclusion, Ripple (XRPUSD) is currently under bearish pressure, with various indicators pointing towards a potential further downside in the near term. Traders should exercise caution and monitor the price action closely for any reversal signals.
Live Analysis
In the current trading session, XRP USD is priced at 0.518, showing a slight decrease of -0.005 or -1.04% compared to the previous close price of $0.523. The trading volume for XRP USD is 991.69 million, which is 55.38% higher than the average trading volume.
Despite the slight decrease in value, XRP USD remains a popular asset with significant trading activity. This drop in value could be influenced by various factors such as market sentiment, regulatory news, or overall market trends. Investors should keep an eye on any developments that could impact the value of XRP USD in the short term.
As the trading session continues, it will be interesting to see how XRP USD performs and whether it can regain its lost value. Traders should remain vigilant and stay informed about any news or events that could affect the asset’s price movement.
Overall, XRP USD remains a dynamic asset in the market, with the potential for both gains and losses. Investors should conduct thorough research and analysis before making any trading decisions to navigate the volatile nature of the cryptocurrency market effectively.
dogecoin
Technical Analysis
Dogecoin USD (DOGEUSD) is currently priced at 0.159, experiencing a price decrease of -0.005 (-2.95%) from the previous close of $0.164. The trading volume stands at 1.21 billion, representing a 49.45% decrease relative to the average volume.
Trend
The simple moving averages indicate a bearish trend, with the 200-day moving average at 12.0612 cents and the 50-day moving average at 15.6024 cents. The Moving Average Convergence Divergence (MACD) shows a negative difference of 0.1111 cents, indicating a potential downtrend.
Volatility
The Bollinger Bands suggest a high level of volatility, with the band width at 25.24. The Keltner Channel also shows significant volatility, with a band width of 15.73.
Momentum
The Relative Strength Index (RSI) is at $54.08, indicating a neutral stance. The Stochastic RSI shows potential oversold conditions with the %K at 55.2543 cents and %D at 64.6465 cents.
Volume Analysis
The Accumulation Distribution Index stands at 20.92 billion, suggesting a divergence in price and volume. The On Balance Volume is at 35.76 billion, indicating buying pressure.
In conclusion, Dogecoin is facing bearish pressure with decreasing trading volume, signaling a potential downtrend. Traders should monitor key support levels and watch for potential reversal signals in the coming sessions.
Live Analysis
Today, Dogecoin USD (DOGEUSD) is priced at 0.159, showing a price change of -0.005 or a decrease of 2.95% compared to the previous close at $0.164. The trading volume for DOGEUSD is currently at 1.21 billion, which is 49.45% higher than the average trading volume.
The decrease in price can be attributed to various factors, including market sentiment, overall cryptocurrency trends, and specific news events related to Dogecoin. Despite the dip in price, the increased trading volume indicates a heightened interest in DOGEUSD, which could lead to further price movements in the near future.
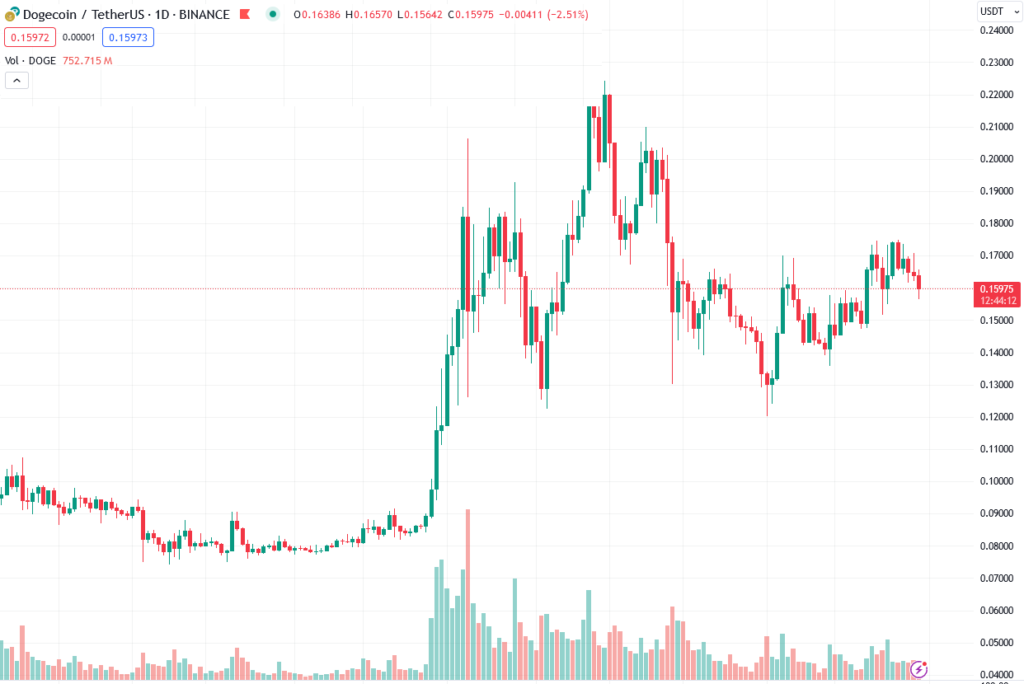
Investors and traders are closely monitoring the performance of Dogecoin USD, analyzing trading patterns and keeping an eye on any significant news that could impact the asset. The current market conditions suggest a level of volatility, which could present both risks and opportunities for those involved in trading DOGEUSD.
Overall, Dogecoin USD continues to be a popular choice among cryptocurrency enthusiasts, with its unique community and history of meme-inspired origins. As the market continues to evolve, it will be interesting to see how DOGEUSD responds to external factors and how traders navigate the ever-changing landscape of the cryptocurrency market.
Cardano (ADA)
Technical Analysis
Cardano (ADAUSD) is currently priced at 0.45, with a slight decrease of 0.001 from the previous close. The trading volume is 338.40 million, which is 56.89% higher than the average. Despite the recent price drop, Cardano shows resilience in the face of market fluctuations.
Trend
Key trend indicators like the Simple Moving Averages (SMAs) suggest a stable performance for Cardano. The SMAs of 10, 21, and 50 days are hovering around the current price, indicating a potential support level. Additionally, the Ichimoku Cloud shows a balanced outlook with conversion and base lines close to the current price.
Volatility
Volatility indicators such as Bollinger Bands and Keltner Channels reflect a moderate level of price variability. The Bollinger Bands’ width stands at 16.68, suggesting a range-bound movement. The Keltner Channel’s band width is narrower at 9.03, indicating a relatively stable price range.
Momentum
Momentum indicators like the Relative Strength Index (RSI) at 44.05 and the Ultimate Oscillator at 46.81 show a neutral sentiment. The Stochastic RSI K and D values are below 50, signaling a potential oversold condition. The Williams %R indicator is deeply negative at -89.13, indicating a possible reversal.
Volume Analysis
Volume indicators highlight mixed signals for Cardano. The Accumulation Distribution Index at 11.86 billion and On-Balance Volume at 3.26 billion suggest accumulation. However, the Chaikin Money Flow is negative at -5.7853 cents, indicating some selling pressure.
In conclusion, Cardano exhibits stability amidst market volatility, with trend indicators suggesting a potential support level. However, investors should monitor momentum and volume indicators for clearer signals of market direction.
Live Analysis
Today, Cardano USD (ADAUSD) is currently priced at 0.45, experiencing a slight decrease of -0.001 compared to the previous close of $0.451. This translates to a price percentage change of -0.223%. The trading volume for ADAUSD is reported at 338.40 million, which is 56.89% higher than the average trading volume.
Despite the decrease in price, Cardano USD continues to attract significant trading activity, indicating ongoing investor interest in the asset. It is essential to keep an eye on any news or events that may impact ADAUSD’s performance in the near future.
Investors should also be mindful of any notable trading patterns that may emerge throughout the trading session. Monitoring these patterns can provide valuable insights into potential price movements and market sentiment surrounding Cardano USD.
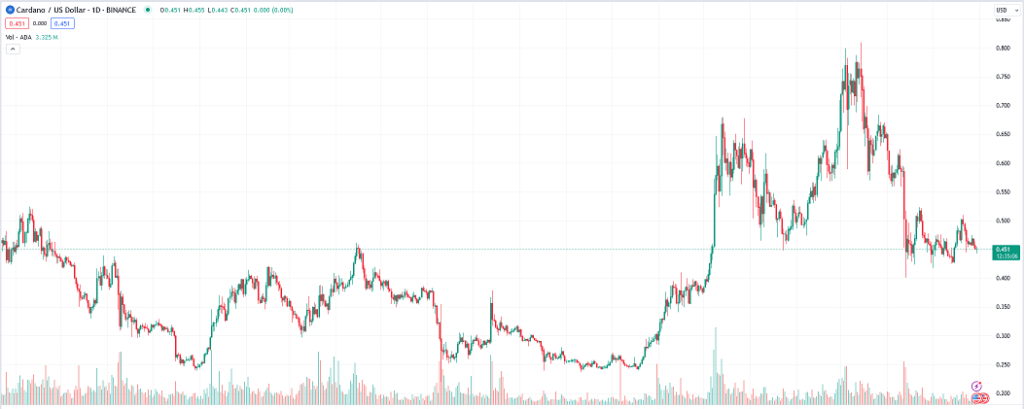
As the trading session progresses, investors and traders alike should stay informed about any developments that could influence ADAUSD’s performance. By staying updated on market trends and news related to Cardano USD, individuals can make more informed decisions regarding their investments in this asset.
Overall, while Cardano USD has experienced a slight decline in its daily performance, it remains a key asset to watch in the cryptocurrency market. Keeping track of price movements, trading volume, and market news is crucial for anyone looking to engage with ADAUSD in the current trading session.
Stay tuned for further updates on Cardano USD as the trading session unfolds.
How to Invest $4,000 in 6 Cryptocurrencies: A Comprehensive Analysis

