Dogecoin Technical Analysis
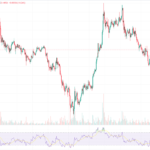
Dogecoin USD (DOGEUSD) is currently priced at 0.104, with a price change of 0.001, representing a 0.78% increase from the previous close at $0.103. The trading volume is at 370.52 million, showing a 39.57% increase compared to the average.
Trend
Analyzing the trend indicators, we see that Dogecoin’s moving averages are showing a positive momentum. The simple moving averages for different periods are all below the current price, indicating a bullish trend. The MACD signal is negative at -0.5195 cents, but the difference is positive at 0.0382 cents, suggesting a potential reversal.
Volatility
Volatility indicators like Bollinger Bands and Keltner Channels show that the price is within normal fluctuations. The Bollinger Bands’ band width is 32.03, indicating moderate volatility. The Keltner Channel’s band width is 13.54, suggesting a relatively stable price range.
Momentum
Momentum indicators like the Relative Strength Index (RSI) at $43.57 and Stochastic RSI at 84.9376 cents are in neutral to overbought territory. The Williams %R indicator is at -26.45, approaching oversold levels, indicating a potential buying opportunity.
Volume Analysis
Volume indicators show healthy trading activity, with the Accumulation Distribution Index at 19.47 billion and On-Balance Volume at 25.67 billion, indicating strong buying pressure. The Money Flow Indicator is at $45.33, suggesting a bullish sentiment.
In conclusion, Dogecoin is currently in an upward trend with moderate volatility. Momentum indicators show a mix of bullish and bearish signals, while volume analysis indicates strong investor interest. Traders should monitor the price closely for potential entry or exit points.
XRPUSD Shows Signs of Bullish Momentum
XRPUSD Technical Analysis
XRP USD is currently priced at 0.568, with a slight increase of 0.002 (0.273%) from the previous close at $0.566. The trading volume is 32.65% higher than the average, standing at 473.83 million.
Trend
Key trend indicators suggest a potential upward movement for XRPUSD. The simple moving averages show a positive trend, with the 21-day and 10-day averages above the 200-day average. The MACD signal is also positive at 0.4857 cents, indicating a bullish momentum.
Volatility
Volatility indicators point towards potential price fluctuations. The Bollinger Bands width is at 25.35, suggesting a wider price range, while the Donchian Channel width is 40.09, indicating increased volatility.
Momentum
Momentum indicators reflect a positive sentiment for XRPUSD. The Relative Strength Index (RSI) is at $50.91, suggesting a balanced market. The Stochastic RSI is at 63.1802 cents, indicating bullish momentum.
Volume Analysis
Volume indicators show strong market participation. The Accumulation Distribution Index is at 49.76 billion, reflecting buying pressure. The On Balance Volume stands at 19.62 billion, supporting the current uptrend.
In conclusion, XRPUSD is displaying positive technical signals, with indicators pointing towards a potential bullish trend. Traders should monitor the price movements closely to capitalize on the market opportunities.
By analyzing these technical aspects, investors can make informed decisions about their XRPUSD positions.
Solana USD Technical Analysis
Technical Analysis
Solana USD (SOLUSD) is currently priced at 145, with a price change of 3.17 (2.23% increase) from the previous close at $141.83. The trading volume is at 1.23 billion, which is 42.94% higher than the average. This suggests increased market activity and interest in Solana USD.
Trend
Key trend indicators show a mix of bullish and bearish signals. The simple moving averages (SMAs) indicate a potential downtrend, with the 200 SMA at 149.31 and the 50 SMA at 153.93. However, the vortex indicator shows a positive trend, with the positive indicator significantly higher than the negative one, indicating a potential bullish momentum.
Volatility
Volatility indicators such as Bollinger Bands and Keltner Channels suggest moderate price variability. The Bollinger Bands’ width is 33.96, indicating price fluctuations within a defined range. The Keltner Channel’s band width is 14.61, suggesting relatively stable price movements.
Momentum
Momentum indicators provide mixed signals. The relative strength index (RSI) is at 43.11, indicating a neutral stance. The stochastic RSI and stochastic indicators hover around the midline, suggesting indecision in the market. The ultimate oscillator at 40.74 indicates a slightly bearish sentiment.
Volume Analysis
Volume indicators show a positive accumulation distribution index of 69.40 billion and on-balance volume of 65.38 billion, indicating buying pressure. The money flow indicator at $49.08 suggests a balance between buying and selling pressure.
In conclusion, Solana USD exhibits a mix of bullish and bearish signals in its technical analysis, with indicators pointing towards potential price fluctuations and indecision in the market. Traders should closely monitor key levels and trends to make informed trading decisions.


