Introduction
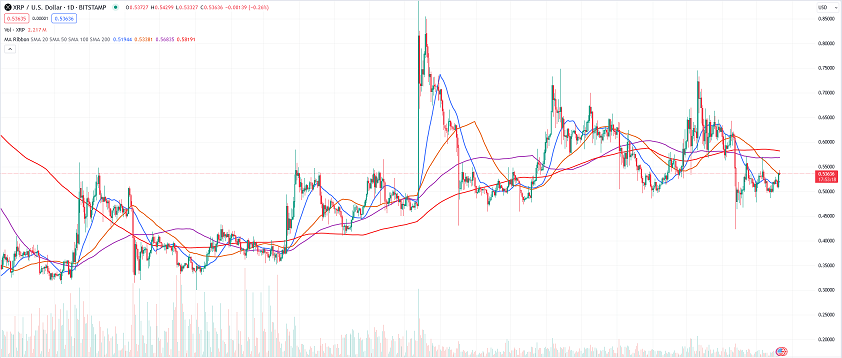
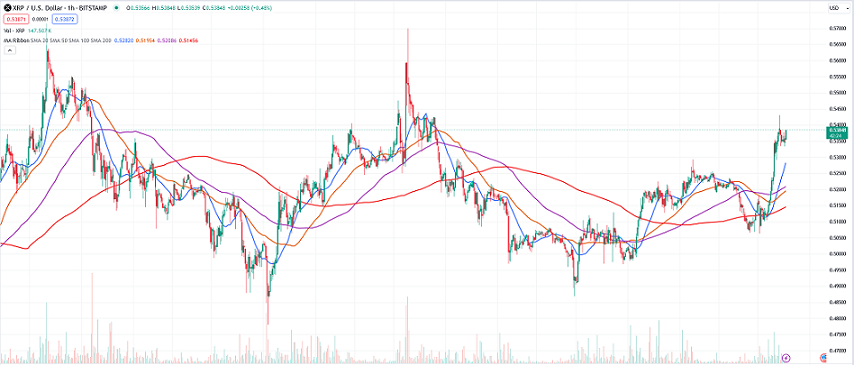
As the cryptocurrency market continues to evolve, Ripple’s XRP remains one of the prominent assets garnering significant attention. Currently, XRP is priced at $0.536, experiencing a slight decrease of -$0.001 with a trading volume of 1.38 billion, representing a 74.87% increase from the average. The price percentage change stands at -0.221% compared to the previous close of $0.537. In this comprehensive article, we delve into the technical analysis of XRP/USD to understand its current market position, underlying trends, volatility, momentum, and volume analysis, and provide a detailed price prediction for potential investors.
Trend Analysis
Understanding the trend is crucial for investors looking to navigate the volatile waters of cryptocurrency trading. Trend indicators such as simple moving averages (SMA) and the Vortex Indicator provide insight into the asset’s price movements.
The simple moving averages show a range of values, indicating varying degrees of bullish and bearish signals. A moving average is calculated by averaging the closing prices over a specific period, and it smooths out the price data to identify the direction of the trend. The Vortex Indicator, on the other hand, presents both positive and negative values, suggesting mixed trend signals. This indicator is particularly useful for identifying trend reversals and confirming the strength of existing trends.
Moreover, the Ichimoku Conversion Line, standing at 50.825 cents, hints at a potential directional shift in the trend. The Ichimoku Cloud, or Ichimoku Kinko Hyo, is a versatile indicator that defines support and resistance, identifies trend direction, gauges momentum, and provides trading signals. The Conversion Line, also known as the Tenkan-sen, is the midpoint of the last nine periods, offering a quick gauge of market sentiment.
In summary, the trend indicators for XRP/USD provide a mixed outlook. While some signals suggest a potential upward trend, others indicate bearish tendencies. Investors should closely monitor these indicators to make informed decisions.
Volatility Indicators
Volatility indicators such as Bollinger Bands and Keltner Channels are essential tools for gauging the potential price movements of an asset. These indicators help investors understand the degree of price fluctuation and predict potential breakouts or pullbacks.
The Bollinger Bands’ bandwidth is 8.63, indicating a moderate level of volatility. Bollinger Bands consist of a middle band (a simple moving average) and two outer bands that represent standard deviations of the price data. When the bands widen, it signifies increased volatility, while narrowing bands indicate reduced volatility.
Similarly, the Keltner Channel’s bandwidth is 5.78, suggesting a narrower trading range. The Keltner Channel is composed of three lines: an exponential moving average (EMA) in the middle and two outer bands set at a fixed percentage of the EMA. This indicator is particularly useful for identifying overbought and oversold conditions.
In the case of XRP/USD, the moderate volatility indicated by the Bollinger Bands and the narrower range suggested by the Keltner Channels imply that the asset is currently experiencing stable price movements. However, investors should remain cautious, as volatility can increase suddenly due to market events or external factors.
Momentum Indicators
Momentum indicators such as the Relative Strength Index (RSI), Stochastic RSI, and Ultimate Oscillator provide insights into the asset’s momentum and help identify potential entry and exit points for trades.
The RSI for XRP/USD is currently at 44.75, which falls within the neutral zone. The RSI measures the speed and change of price movements on a scale of 0 to 100. An RSI above 70 typically indicates that the asset is overbought, while an RSI below 30 suggests that it is oversold.
The Stochastic RSI, standing at 47.7112 cents, offers a more sensitive measure of momentum. This indicator is derived from the standard RSI and oscillates between 0 and 100. It helps identify overbought and oversold conditions more precisely.
The Ultimate Oscillator, at 41.63, reflects the overall momentum strength. This oscillator combines short, medium, and long-term price movements to provide a comprehensive view of the asset’s momentum.
Based on these momentum indicators, XRP/USD appears to be in a neutral to slightly bearish state. Investors should watch for changes in these indicators to identify potential buying or selling opportunities.
XRP Volume Analysis
Volume analysis is a critical aspect of technical analysis, as it provides insights into market sentiment and the strength of price movements. Volume indicators such as the Accumulation Distribution Index (ADI) and On Balance Volume (OBV) highlight the buying and selling pressure on the asset.
The ADI measures the cumulative flow of money into and out of an asset, while the OBV uses volume flow to predict changes in the price. A rising OBV indicates that the volume on up days is outpacing the volume on down days, suggesting bullish momentum.
Additionally, the Volume Weighted Average Price (VWAP) at 51.3177 cents provides a volume-weighted perspective of the asset’s price. The VWAP is calculated by taking the total dollar value of trading in the asset and dividing it by the total volume traded over a specific period. It represents the average price at which the asset has traded throughout the day and is a valuable tool for assessing market value.
The significant trading volume of 1.38 billion for XRP/USD, which is 74.87% higher than the average, indicates robust investor interest and activity. This high volume can be a precursor to significant price movements, as increased trading activity often leads to heightened volatility.
Market Sentiment and External Factors
In addition to technical indicators, market sentiment and external factors play a crucial role in influencing the price of XRP/USD. News events, regulatory developments, and macroeconomic trends can have a significant impact on the cryptocurrency market.
For instance, positive news such as partnerships, technological advancements, or favorable regulatory decisions can boost investor confidence and drive up the price of XRP. Conversely, negative news such as regulatory crackdowns, security breaches, or macroeconomic uncertainties can lead to price declines.
Investors should stay informed about the latest developments in the cryptocurrency space and be prepared to adjust their strategies based on new information. Monitoring social media, news outlets, and industry reports can provide valuable insights into market sentiment and potential price drivers.
Conclusion and Price Prediction
In conclusion, XRP/USD is currently navigating through a complex landscape of volatility, momentum, and market sentiment. The trend indicators provide a mixed outlook, while the volatility and momentum indicators suggest stable but cautious trading conditions. The significant trading volume indicates continued interest from investors, highlighting the asset’s popularity.
Based on the current technical indicators and market sentiment, XRP/USD may face moderate volatility in the near term. If the asset can maintain its support levels and overcome resistance points, we might see a price increase toward the $0.55 to $0.60 range in the coming weeks. However, investors should remain vigilant and keep an eye on market developments to adjust their strategies accordingly.
As the trading session continues, it will be interesting to see how XRP/USD performs and whether it can regain its momentum in the market. Investors should exercise caution and conduct thorough research before making any investment decisions involving XRP/USD.
Final Thoughts
The cryptocurrency market is inherently volatile and influenced by a myriad of factors. While technical analysis provides valuable insights into price movements and trends, it is essential to consider the broader market context and stay informed about external events that could impact the market. By combining technical analysis with a keen understanding of market sentiment and external factors, investors can make more informed decisions and navigate the dynamic world of cryptocurrency trading with greater confidence.
Stay tuned for further updates on XRP/USD as the trading session progresses.