Bitcoin Technical Analysis, Trend analysis, Volatility, Momentum and volume analysis with overview and summary of the key points.
Analyzing Bitcoin’s Technical Position
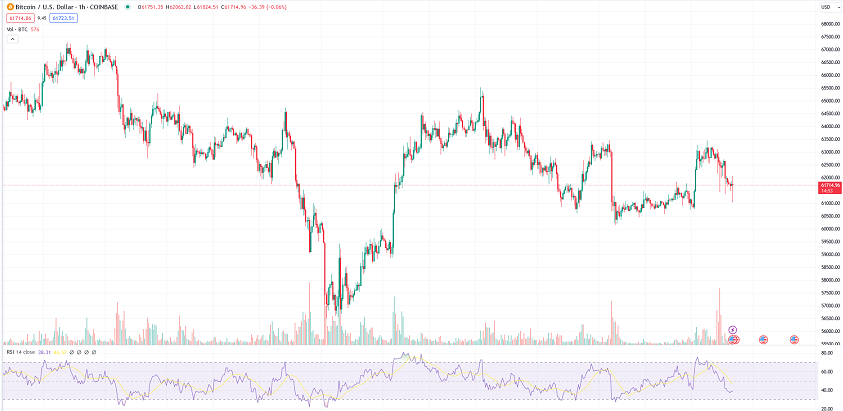
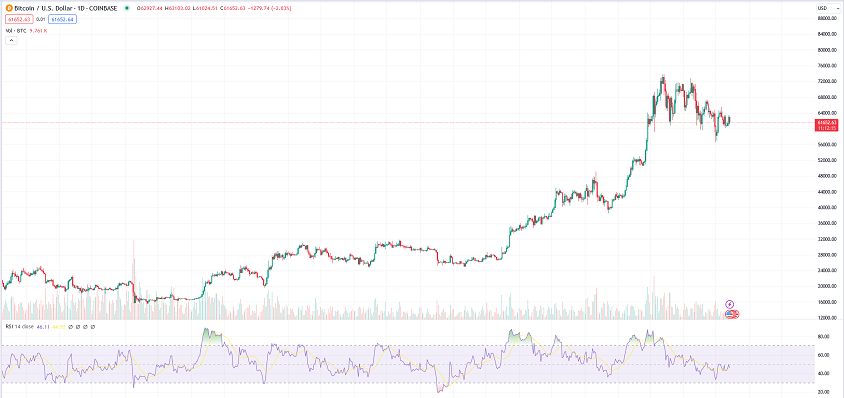
Currently valued at 61,830 USD, Bitcoin’s price has decreased by 1,083.97 USD or 1.72% compared to the previous closing price of 62,900 USD. The trading volume stands at 25.10 billion, a significant 67.64% above the average.
bitcoin Trend Analysis
Bitcoin is currently trading above its 51,200 USD simple moving average but below the 65,400 USD level. The Moving Average Convergence Divergence (MACD) is -987.41, indicating a bearish trend. The Ichimoku Conversion Line sits at 62,889 USD, surpassing the Ichimoku Base Line of 62,268 USD, potentially signaling a bullish trend ahead.
bitcoin Volatility Metrics
Bollinger Bands are narrowing with a band width of 11.07, while the Keltner Channel Band Width is at 6.92, suggesting reduced price variability. The Average True Range at 2,534.25 USD reflects the current market volatility.
bitcoin Momentum Indicators
The Relative Strength Index (RSI) at 44.8 indicates a neutral stance. Stochastic RSI is at 68.2957, hinting at a possibility of being overbought. Williams %R of -46.37 implies Bitcoin is nearing oversold conditions.
bitcoin Volume Assessment
With the Accumulation Distribution Index at 710.84 billion, there is strong buying pressure. The On-Balance Volume stands at 692.69 billion, supporting a positive trend. The Money Flow Indicator sits at $40.82, reflecting bullish sentiment.
overview
Bitcoin Price Analysis Live:
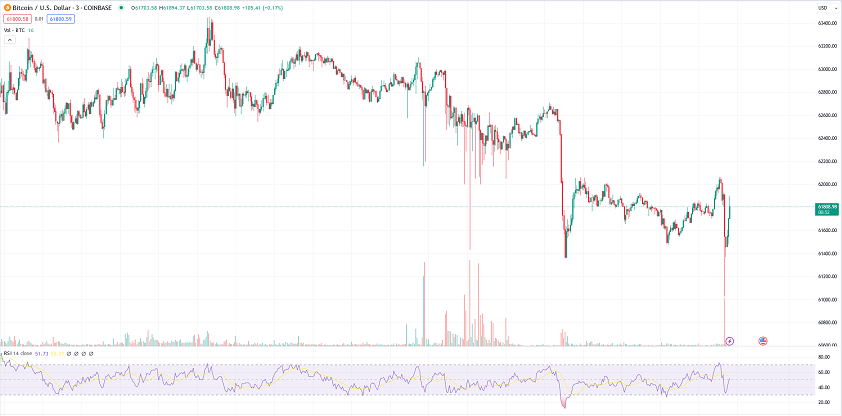
The current price of Bitcoin in USD (BTCUSD) stands at 61,800, marking a decrease of 1,102.79 (1.75%) from the previous close at $62,900. The trading volume for BTCUSD is currently at 25.10 billion, a significant increase of 67.64% compared to the average volume. These price fluctuations, accompanied by a surge in trading activity, hint at a potential shift in market sentiment towards Bitcoin.
Analyzing Performance Trend:
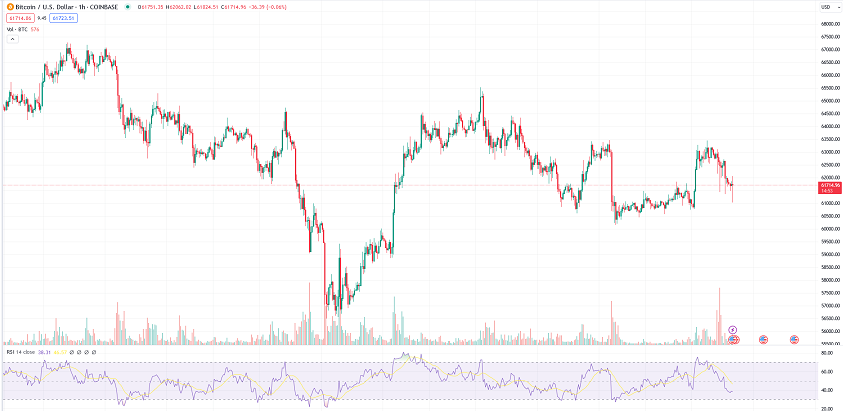
BTCUSD has been following a three-day streak of price movements, with an absolute change of 1,000 and a percentage change of 1.68%. The streak commenced at a price of 60,800, demonstrating a consistent pattern in Bitcoin’s pricing behavior over the recent days, which investors should closely observe for potential trends.
summary of the key points
Bitcoin’s technical analysis reveals a complex picture of the market. Here is a summary of the key points and overview:
- Price Movement: Bitcoin’s current price is 61,830 USD, showing a decrease from the previous closing price. The trading volume is significantly higher than average, indicating heightened market activity.
- Trend Analysis: Bitcoin is above its 51,200 USD moving average but below the 65,400 USD level. The MACD suggests a bearish trend, while the Ichimoku Conversion Line surpassing the Base Line could signal a potential bullish trend ahead.
- Volatility Metrics: Bollinger Bands and Keltner Channel Band Width indicate reduced price variability. However, the Average True Range reflects the current high market volatility.
- Momentum Indicators: The RSI suggests a neutral stance, while the Stochastic RSI hints at possible overbought conditions. The Williams %R indicates Bitcoin is nearing oversold levels.
- Volume Assessment: Strong buying pressure is shown by the Accumulation Distribution Index and the On-Balance Volume, supporting a positive trend. The Money Flow Indicator reveals bullish sentiment. In summary, the market for Bitcoin is volatile with mixed signals from various indicators. Traders are advised to closely monitor trends, volatility, momentum, and volume to make informed decisions in this dynamic environment.
Unveiling the Future: Bitcoin’s Journey to an All-Time High
Trump Works with Bitcoin Magazine CEO on Crypto Plan for First Day in Office

