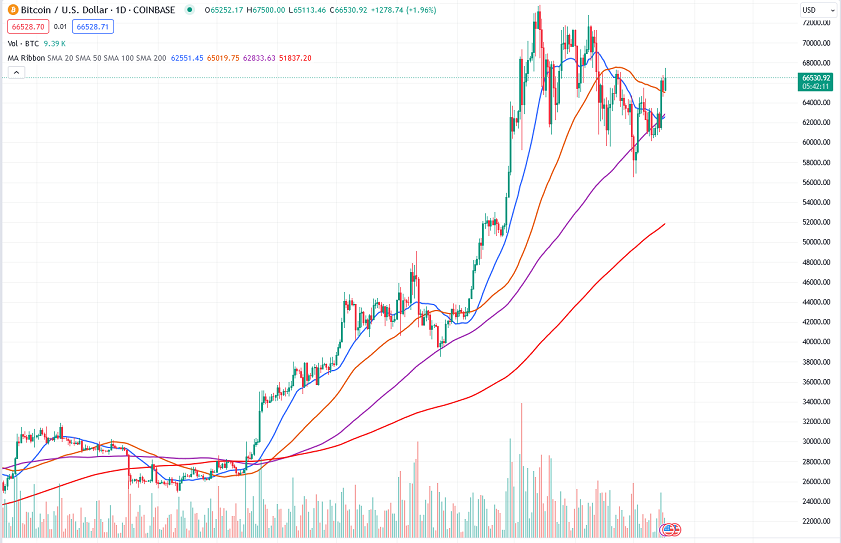
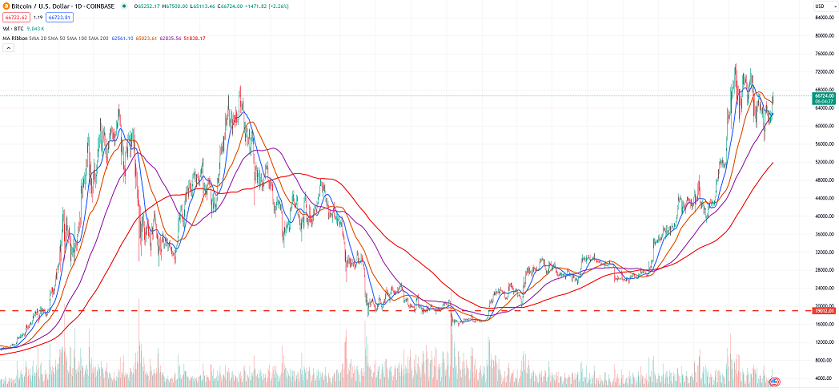
for bitcoin technical analysis we look at the the daily price movements of Bitcoin (BTC) against the US Dollar (USD) on Coinbase. The chart includes several technical analysis tools, such as moving averages and momentum indicators, which we will analyze to understand the current and potential future price trends of Bitcoin.
bitcoin Moving Averages Analysis
1. Simple Moving Averages (SMA):
- 20-day SMA (blue): This short-term moving average is currently trending upwards, indicating short-term bullish momentum.
- 50-day SMA (orange): The mid-term moving average is also trending upwards, supporting the view of ongoing bullish sentiment.
- 100-day SMA (purple): This long-term moving average is in an upward trend, indicating a sustained bullish market over the longer term.
- 200-day SMA (red): The 200-day SMA serves as a strong indicator of the overall market trend and is currently in an upward trajectory, reinforcing the long-term bullish outlook.
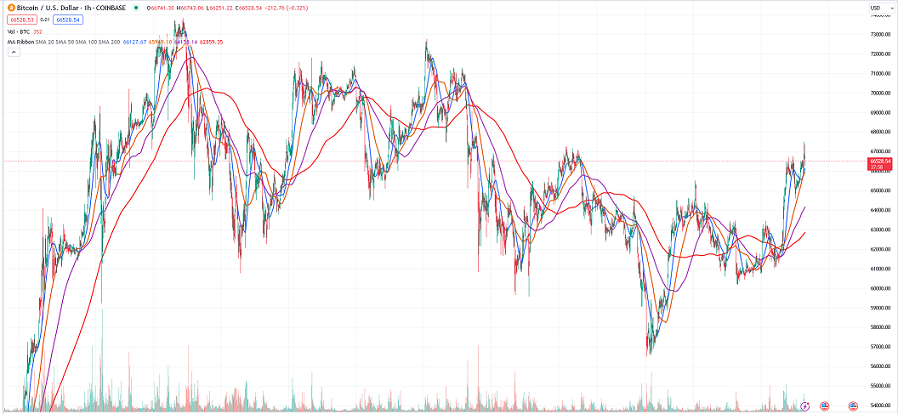
2. Moving Average Ribbon: The moving average ribbon (a series of multiple moving averages) shows a clear upward spread, which is a bullish signal. The price is trading above the majority of these moving averages, suggesting strong support levels below the current price.
bitcoin Price Action and Patterns
1. Historical Price Movements:
- Previous Peaks: The chart highlights previous peaks in Bitcoin’s price around $64,000 to $69,000 during late 2021 and early 2022. These levels are significant as they could act as future resistance points.
- Corrections and Consolidations: After reaching highs, Bitcoin underwent significant corrections, with major support forming around $19,000, which held during the bear market phases of 2022.
2. Recent Trends:
- The price action since late 2023 shows a recovery and upward movement, breaking past previous resistance levels around $30,000 to $40,000.
- The recent peak in 2024, reaching approximately $68,000, followed by a correction, suggests the formation of a new resistance level.
bitcoin Momentum Indicators
1. RSI (Relative Strength Index):
- Although not explicitly shown in the image, the RSI is typically used to gauge whether a security is overbought or oversold. Given the recent price surge, checking the RSI could indicate whether Bitcoin is in overbought territory, signaling a potential pullback.
2. MACD (Moving Average Convergence Divergence):
- The MACD, often used to identify changes in the strength, direction, momentum, and duration of a trend, would provide further insights if included. Generally, a bullish crossover (when the MACD line crosses above the signal line) would indicate upward momentum, while a bearish crossover would suggest a downward trend.
bitcoin Volume Analysis
- Volume Trends: Volume spikes often accompany significant price moves, indicating strong investor interest. The chart shows higher volume during major price movements, which supports the validity of these moves.
- Volume Squeeze: Lower volume periods often precede significant price moves. Observing the volume can help anticipate potential breakouts or breakdowns.
Support and Resistance Levels
Support Levels:
- $19,000: A major support level that held during the 2022 bear market.
- $30,000 – $40,000: Previous resistance levels that may now act as support.
Resistance Levels:
- $74,000 – $69,000: Previous all-time highs that Bitcoin needs to surpass to reach new peaks.
- $50,000: A psychological level that could act as both support and resistance in the near term.
Conclusion
The technical analysis of Bitcoin’s daily price chart indicates a predominantly bullish trend supported by multiple moving averages pointing upwards. Key support levels at $19,000 and $30,000-$40,000 provide strong bases, while the resistance around previous all-time highs ($64,000-$69,000) needs to be breached for further upward momentum. Monitoring volume trends, RSI, and MACD will provide additional insights into potential price movements and help in making informed trading decisions.
Summary of Key Points:
- Moving Averages Analysis:
- Short-term, mid-term, and long-term SMAs are all trending upwards, indicating bullish momentum.
- Moving average ribbon shows a bullish spread with price above most averages.
- Price Action and Patterns:
- Previous peaks around $74,000-$69,000 are significant resistance levels.
- Strong support observed at $19,000 and previous resistance levels now potentially acting as support.
- Recent Trends:
- Recovery and upward movement seen since late 2023.
- Recent peak around $68,000 followed by a correction, suggesting a new resistance level.
- Momentum Indicators:
- RSI and MACD not explicitly shown but could provide insights into overbought/oversold conditions and momentum changes.
- Volume Analysis:
- Volume spikes accompany significant price moves, indicating strong investor interest.
- Lower volume periods can precede breakout or breakdown movements.
- Support and Resistance Levels:
- Key supports at $19,000 and $30,000-$40,000.
- Resistance at previous highs of $74,000-$69,000 and psychological level at $50,000. In conclusion, the technical analysis suggests a bullish trend for Bitcoin, supported by moving averages and key support levels. Monitoring indicators like RSI, MACD, and volume trends can provide additional insights for trading decisions.
References
- TradingView Bitcoin Price Chart
- CoinDesk: Bitcoin Price Analysis
- Investopedia: Understanding Moving Averages
- Binance Academy: Technical Analysis Basics