Technical Analysis
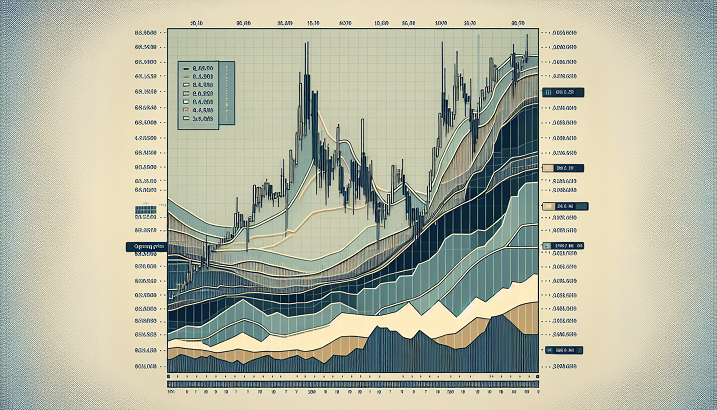
Bitcoin USD (BTCUSD) is currently priced at 60,105, marking a 618.81 increase from the previous close of 59,500. The trading volume is at a significant 46.56%, amounting to 13.94 billion. Despite recent fluctuations, Bitcoin USD is showing a 1.04% price percentage change, indicating positive momentum.
Trend
Analyzing the trend indicators, the simple moving averages reveal a mixed picture. The 200-day moving average stands at 62,523, while the 50-day moving average is at 61,629. The short-term averages, such as the 5-day and 3-day moving averages, suggest a potential reversal as they are below the current price. The MACD signal is negative at -$1,217.32, indicating a bearish trend.
Volatility
Volatility indicators show that Bitcoin USD is experiencing significant price variability. The Bollinger Bands have a wide band width of 21.98, with the high band at 66,300 and the low band at $53,179. This indicates a high level of price fluctuation and potential trading opportunities.
Momentum
In terms of momentum, Bitcoin USD has a relative strength index (RSI) of 47.13, suggesting a neutral position. The stochastic RSI is high at 88.43 cents, indicating potential overbought conditions. The ultimate oscillator is at 44.56, reflecting a moderate momentum level.
Volume Analysis
Volume indicators show mixed signals for Bitcoin USD. The accumulation distribution index is at a significant $608.68 billion, indicating strong buying pressure. However, the Chaikin Money Flow is negative at -0.5676 cents, suggesting some selling pressure in the market.
In conclusion, Bitcoin USD is experiencing positive momentum amidst volatile market conditions. Traders should closely monitor the trend, volatility, momentum, and volume indicators to make informed trading decisions.
Moving Averages
| Name | Value |
|---|---|
| Simple Moving Average (3) | 58,641.06 |
| Simple Moving Average (5) | 59,043.40 |
| Simple Moving Average (10) | 59,680.10 |
| Simple Moving Average (21) | 60,079.16 |
| Simple Moving Average (50) | 61,629.15 |
| Simple Moving Average (200) | 62,523.42 |
| Exponential Moving Average Fast (12): | 59,366.26 |
| Exponential Moving Average Slow (26): | 60,501.33 |
| Ichimoku Base Line 9/26/52 | 59,525.01 |
Oscillators
| Name | Value |
|---|---|
| Average True Range | 3,323.15 |
| MACD (12, 26) | -1,135.07 |
| ADX (14) | 28.09 |
| Commodity Channel Index 20 | -11.88 |
| RSI (14) | 47.13 |
| Stochastic RSI (14) | 0.88 |
| Ultimate Oscillator (7/14/28) | 44.56 |
| Williams Percent Range (14) | -23.82 |
| Awesome Oscillator | -3,304.39 |
| Rate of Change (12) | 10.11 |
Pivot Points
| Name | Value |
|---|---|
| R3 | 61,150.16 |
| R2 | 60,242.59 |
| R1 | 59,866.58 |
| S1 | 58,959.01 |
| S2 | 58,427.45 |
| S3 | 57,519.88 |
Bitcoin Technical Analysis and Market Trends: June 2024


